
Pillar: Visibility
Control Tower in real time
A single dashboard to see, anticipate and act on your whole chain, from the warehouse to the last delivery. The AI learns from every trip: the ETA range drops from 30 to 10 minutes after a few months of operation.
You operate blind until the problem has already blown up
- Fragmented information: each system shows its own piece.
- Late reaction: you find out about problems once they've already hit.
- Weak ETAs: you give a wide window and the customer calls anyway.
- Manual reports: hours building Excel for management.
- Customers in the dark: they can't see the status of their order.
Your whole operation on a single screen
Live dashboard
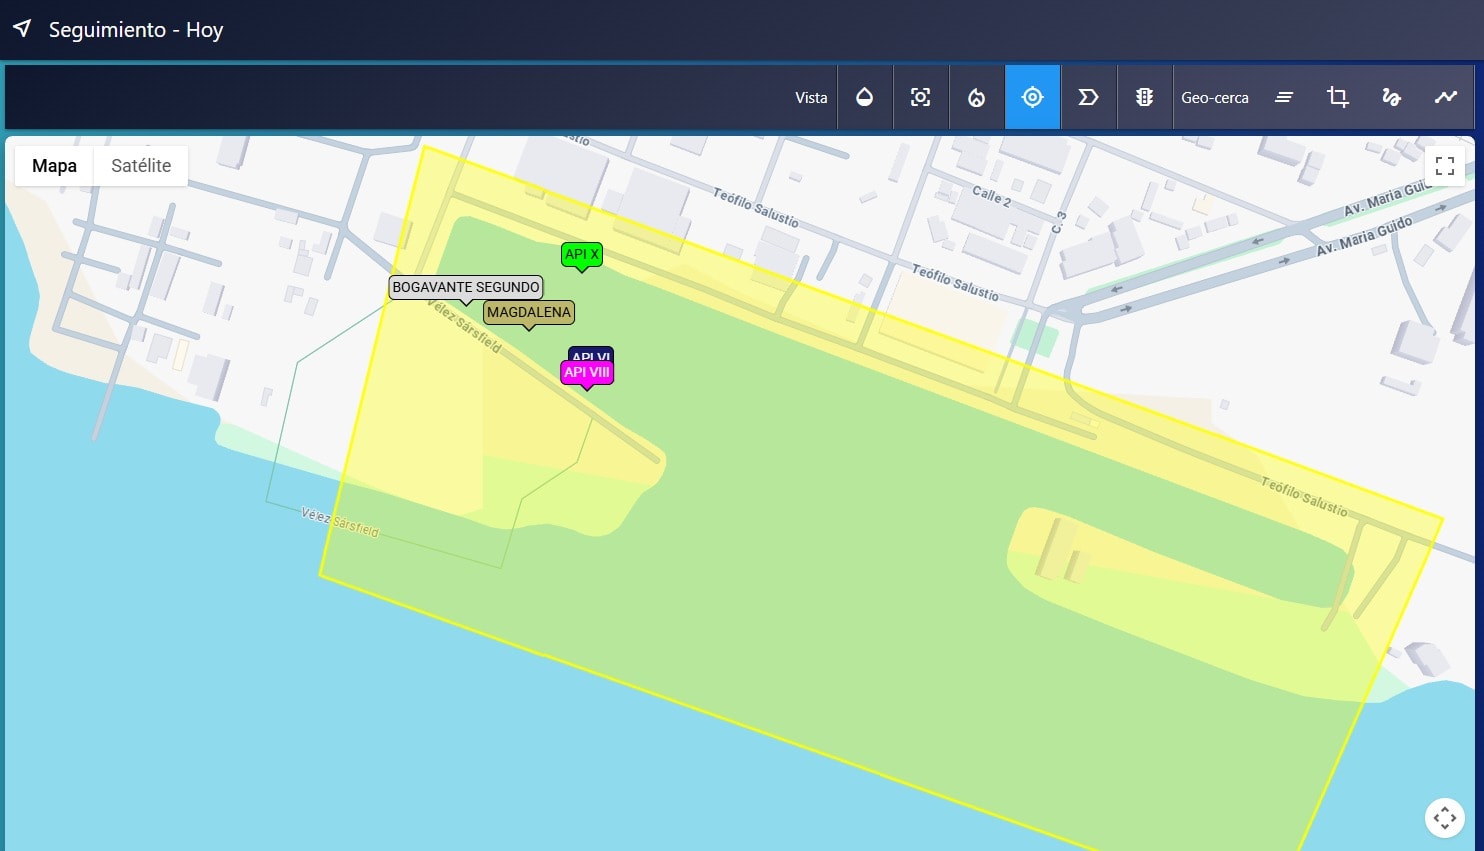
Operations map with every truck, delivery status, active alerts and the day's KPIs against the average. You see everything, live.
ETA that improves on its own
The AI learns from every delivery: the ETA range drops from 30 to 20, to 15, to 10 minutes after about 3 months, by driver, by customer and by number of packages.
Proactive alerts
Stopped truck, delay at a customer, late route or compromised cold chain. By dashboard, email, WhatsApp or SMS, before it becomes a complaint.
Customer portal
The customer sees where their delivery is, live ETA, history and documents, with a non-intrusive push notification. Automatic daily, weekly and monthly reports.
Your whole fleet on one board, with the exception on top
Trips, stops and ETAs in real time. When something drifts from the plan, the Control Tower flags it, recalculates and notifies before the customer complains.
Control TowerLive
Distribution · Morning shift
- Active trips
- 48
- Within window
- 47
- Exceptions
- 1
| Unit | Stop | ETA window | Status |
|---|---|---|---|
| U-122 | 8 of 16 | 09:05–09:15 | Delayed |
| U-104 | 5 of 14 | 08:10–08:20 | En route |
| U-117 | 3 of 11 | 08:25–08:35 | At customer |
| U-131 | 2 of 9 | 08:40–08:50 | En route |
| U-138 | Dock 4 | 10:30–10:40 | Loading |
Delay at customer: +40 min
Unit U-122 at stop 8. Remaining route recalculated and new ETA sent to the next 2 customers.
ETA window for the same delivery
Learns by driver, customer, time slot and case count
- 01Every trip against its planUnit, stop, delivery window and status in one view, for owned, outsourced or mixed fleets.
- 02Exceptions trigger actionsThe driver reports a delay: the system recalculates the rest of the route and sends the new ETA to the customers that follow.
- 03The ETA window narrows on its ownThe AI learns by driver, customer, time slot and case count. In about 3 months of operation, the window goes from 30 to 10 minutes.
0 minETA range, down from 30 to 10 after a few months
- 3 months For the AI to learn your operation
- 90 days In production, not 6 to 12 months
From finding to go-live
- 23 vesselsA fishing fleet23 vessels in production with telemetry and a Control Tower. Operations at sea, the plant and the trucks on a single screen.See the case
- ImplementationA pilot before the contractA 13-week plan with deliverables per phase and go-live criteria.See the methodology
- ROICalculate payback with your dataTrucks, cost per trip and manual routing hours. You adjust the assumptions.Open the calculator
What does every incident you catch too late cost you?
Book a demo and bring iWMS, iTMS, iRouter and palletizing together on one dashboard.